“There are three things that matter in property: location, location, location”
Harold Samuel
Those are words from Harold Samuel, a British real-estate mogul from the 1900s. Broadly speaking, it’s a quote that still holds true—property values in the world’s best cities have always been worth a pretty penny.
The scarcity of real estate is driven by trends such as urbanization, which is the migration of people into cities. While the first examples of cities were built thousands of years ago, it was only recently that the majority of the population began to live in them. In fact, the urban population just overtook the rural population for the first time in 2007.
Related: Florida has highest home vacancy rate in the country
Of course, certain cities simply hold more appeal for wealthy people, and as a result, competition in the prime real estate market can be fierce.
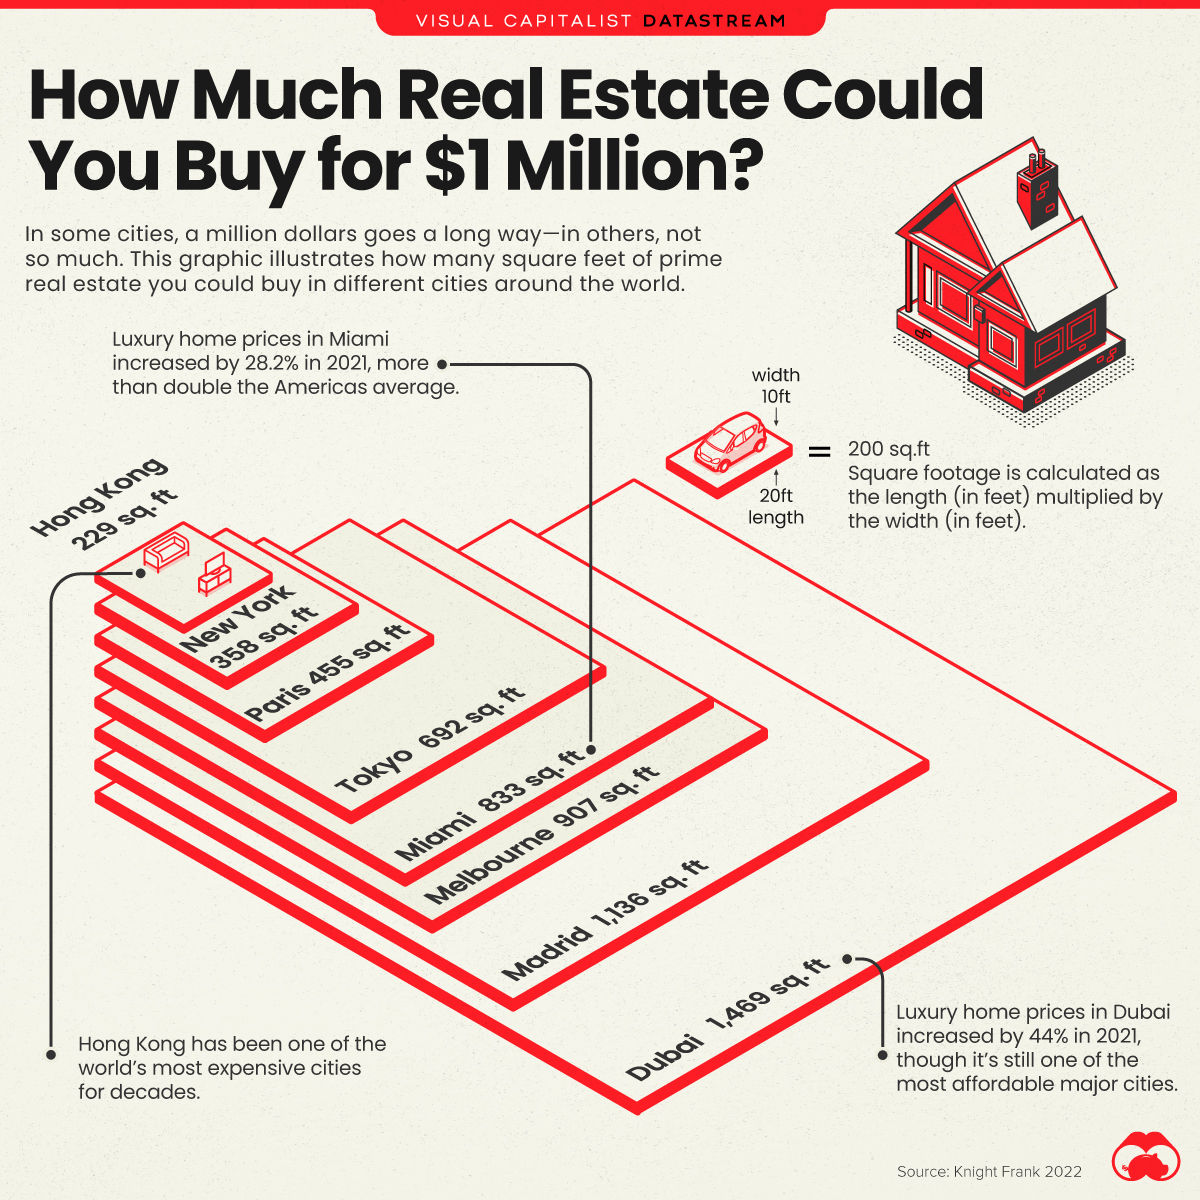
To learn more about the sky-high cost of prime property in cities, this infographic visualizes data from Knight Frank’s Prime International Residential Index (PIRI 100).
What’s a million dollars good for?
The following table lists the number of square feet that you could buy with one million dollars in various cities. We’ve included more cities on this list than in the graphic to create a more comprehensive comparison.

Monaco, the most expensive city on this list, is incredibly land-constrained with an area of just 0.78 square miles. For context, New York’s Central Park is 1.31 square miles in size.
In second place is Hong Kong, which has become notorious for its difficult real estate market. Just 7% of the city is zoned for residential use, which pushes many of its citizens into sub-100 square feet micro apartments. These housing units offer grim living standards and are often referred to as “coffin homes”.
On the other side of the spectrum, Hong Kong recently set the record for the most expensive home in Asia. A 3,378 square foot penthouse sold for $59 million in 2021, translating to $17,500 per square foot.
What is prime real estate?
You may be wondering what prime real estate is.
Knight Frank defines it as “the most desirable and expensive property in the area, generally defined as the top 5% of the market by value.” This suggests that the prices visualized above are on the upper end of the scale, and that more attainable homes are available.


